
Reporting Wiki
Regular Email Reporting
You can receive regular email summaries of each online advertising order. We send these emails every Monday evening. You can elect for the following frequency:
Weekly: Every Monday (the date range of data is the previous 30 days)
Monthly: 3rd day of every month (the date range of data is the previous month)
Twice Monthly: The second and fourth Mondays of the month (the date range of data is the previous 30 days).
Official Schedule:
Dates 1–7: Week 1 = weekly, monthly
Dates 8–14: Week 2 = weekly, twice monthly
Dates 15–21: Week 3 = weekly
Dates 22–31: Week 4 = weekly, twice monthly
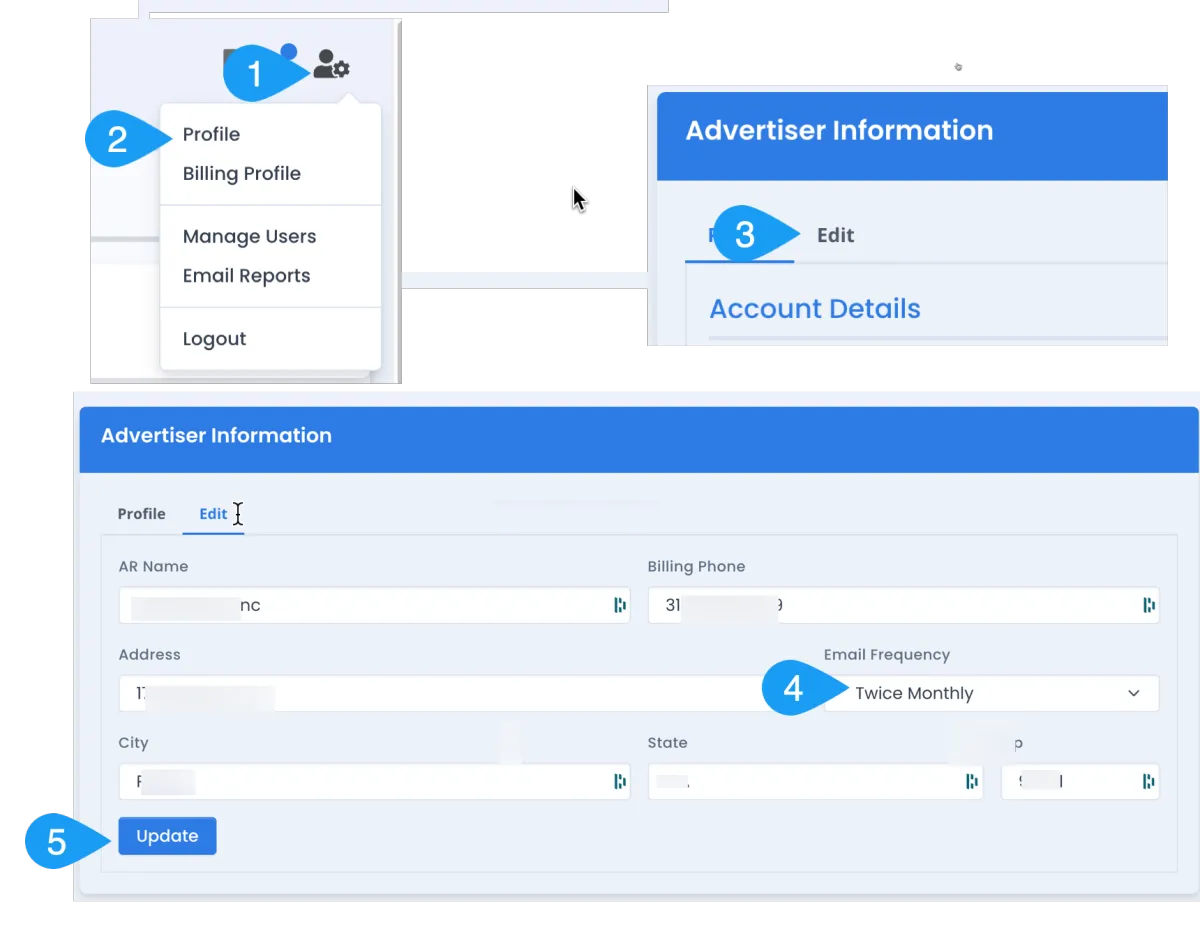
How to Sign up for regular email summaries:
- Ask your Digital Throttle sales rep to setup your schedule
- In https://reporter.digitalthrottle.com, you can set your email frequency:
Example of Email
email will be sent from [email protected]
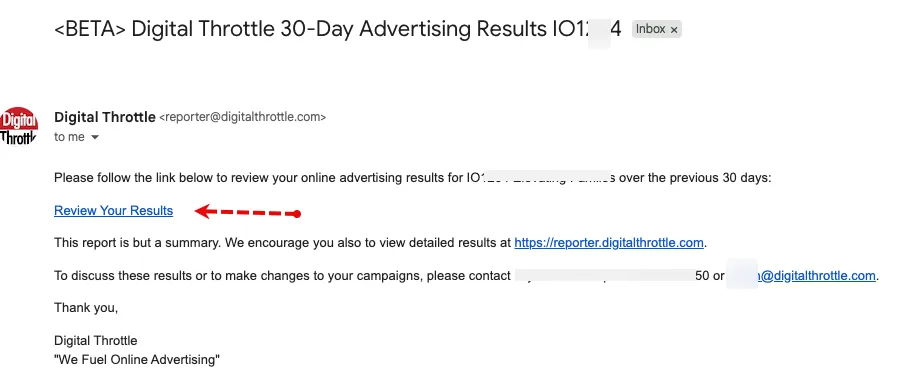
email will contain a link to your report
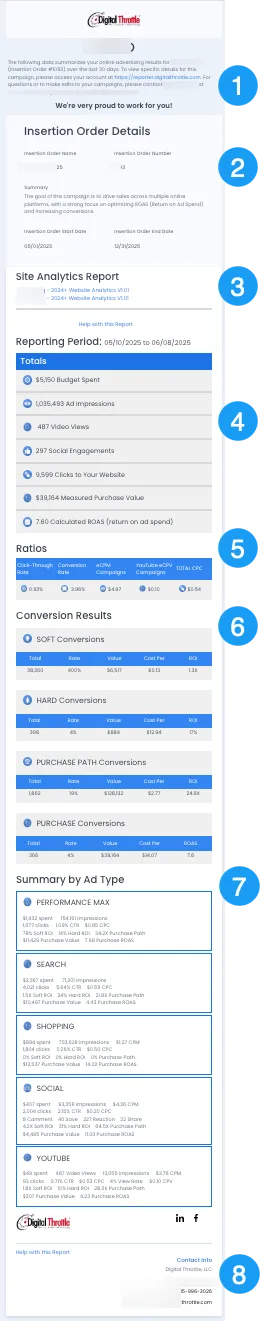
Example of Linked Report in the Email
See the corresponding numbers for explanations of each section.
SECTION 1 & 2 Details
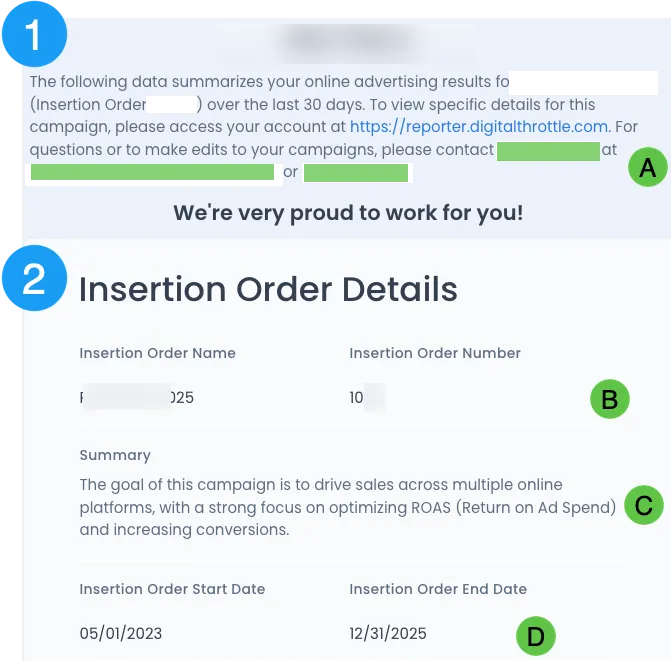
(A) Your Digital Throttle Sales Contact is listed here. They are also cc'd on the report.
(B) The name of your online advertising order and it's assigned insertion order (aka "IO") are listed here.
(C) We may show a short summary of your online advertising order goals and details.
(D) We show the first and last date your online ads are scheduled to run here.
SECTION 3 Details
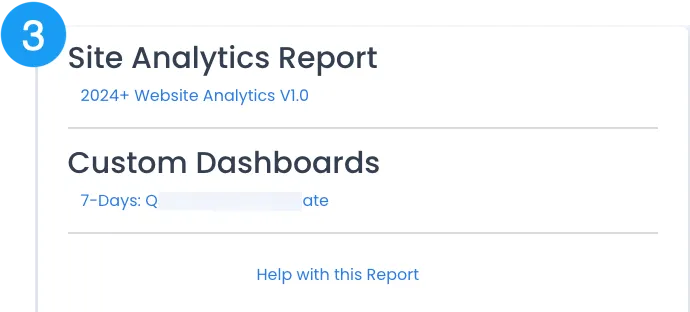
(A) This links to your total site traffic results. See HERE for details on this report.
(B) You may also have a custom report that is a pre-built filter. You will need to be logged into https://reporter.digitalthrottle.com to view this custom dashboard.
SECTION 4 Details
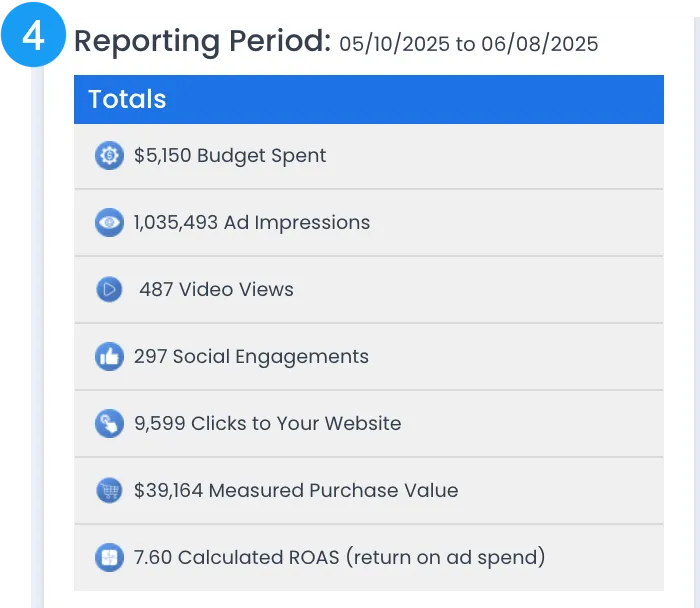
Using the numbers shown above, here is how to interpret the results for the reporting period shown (in this case 5/10/25 to 6/8/25):
- Amount Spent for the reporting period was $5,150 (we round)
- The total number of times all ads were seen (impressions) was 1,035,493
- The video ads (on YouTube or streaming) were viewed 487 times. In the case of YouTube, we count views only from persons that do not click the "skip" button - typically watch at least 7 seconds of the video.
- The social ads also received 297 engagements such as sharing, saving, liking & commenting on the social post.
- The advertiser received 9,599 website(s) visits from clicks on all their ads.
- For clients selling on their websites, Digital Throttle ads generated $39,164 in e-commerce orders we can definitely measure. (Note there will always be more online orders than we can measure for various technical and device privacy settings.)
- Considering just the e-commerce revenue, the ROI from the paid advertising is 7.60. The common term is a 7.60 ROAS - "return on ad spend" & calculated by dividing the Measured Purchase Value by Budget Spent [$39,164 / $5,150] = 7.60. Think of ROAS as a multiplier - in this case "for every $1 spent, the ads ads sold $7.60."
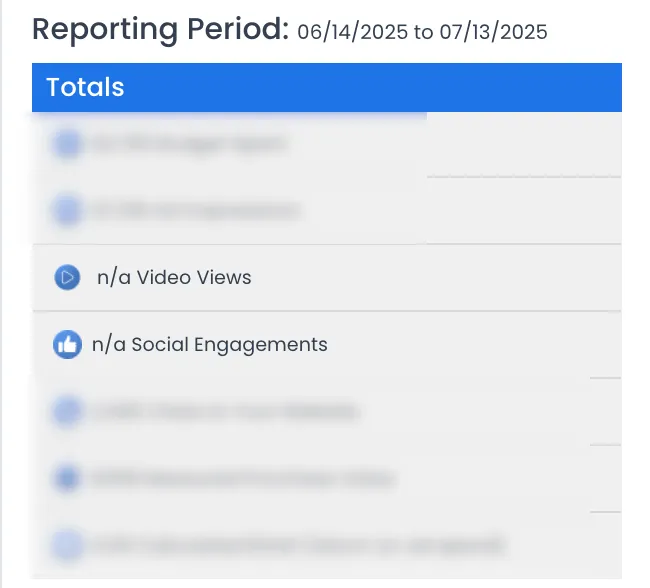
NOTE: if you see a "n/a" like shown below, that means you are not using that type of ad. If we're not tracking e-commerce sales, you will also see a "n/a" listed. In this example, there are no social or video ads being used.
SECTION 5 Details
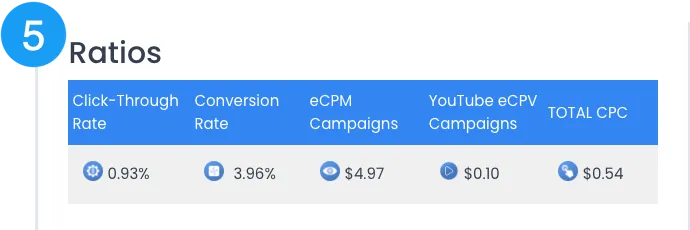
Common practice is to use ratios to compare different forms of online advertising. In this manner you can compare effectiveness no matter the amount spent. Using this report, here are the calculations for the above:
- Click-Through Rate (CTR): 9,599 clicks to the website divided by 1,035,493 ad impressions = 0.93%
- Conversion Rate: the sum of the 40,986 Soft+Hard+Purchase Path+Purchase conversions divided by the 1,035,493 ad impressions = 4%
- eCPM: measures how much was spend for every 1,000 ad impressions. $5,150 spent divided by 1,035,493 ad impressions divided by 1,000 = $4.97
- YouTube eCPV: measures how much was spent for each view of a YouTube ad. $49 spent on YouTube divided by the views of 487 = $0.10
- Total CPC: measures how much was spent for each click to the website. $5,150 spent divided by 9,599 clicks = $0.54
SECTION 6 Details
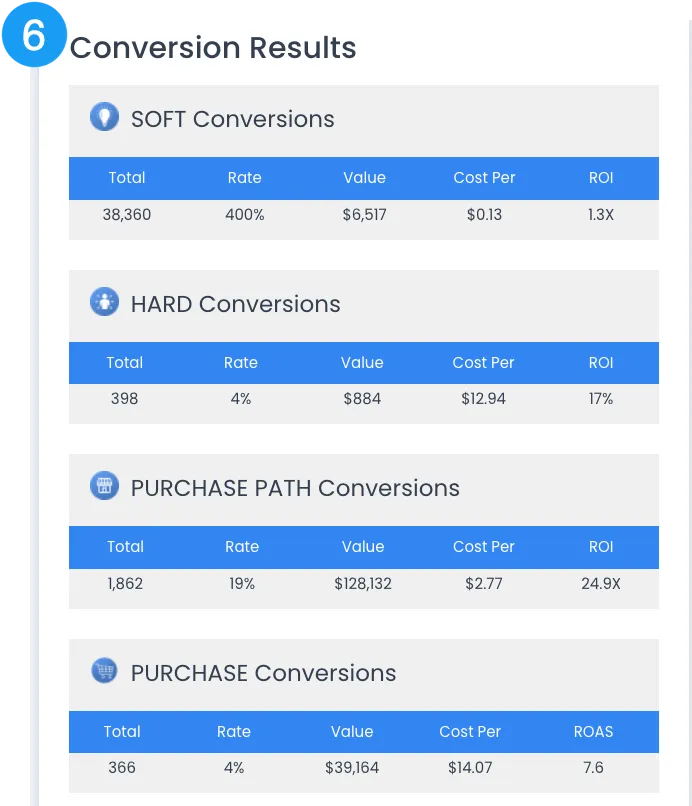
If you have added our Wrapper Google Tag Manger to your website(s), we're able to measure valuable conversion actions that people completed after clicking upon the online ads. We group the conversions into 4 basic types:
Soft Conversions measure "Engagement" on your website for people clicking on your digital ads.. We count three actions (a) How many people scroll at least 50% down one of your webpages PLUS (b) how many people stayed on your site for more than 1 minute; PLUS (c) how many people visited 3 or more pages during their visit.
Hard Conversions measure key click actions on your site such as watching a video, downloading a catalog, signing up for a newsletter, or sending you an email. the person is more than spending time or surfing around your site, he is actively using your site.
Purchase Path conversions count any activity on your site indicating "purchase intent". Add to Cart & Initiate Checkout are two examples. So too is "Find a Dealer". In the case of Add to Cart and Initiate Checkout, we capture the actual e-commerce dollar values. In the case of "find a dealer" we have assumed a reasonable value, such as $25 for each click to a dealer's website.
Purchase Conversions count how many e-commerce orders the paid ads generated. This is typically under-reported as there are technical and user privacy settings preventing complete purchase tracking. Value is the total e-commerce revenue (excluding taxes and shipping). "ROAS" is the order value amount divided by the Budget Spent. Think of ROAS as a multiplier - "for every $1 of budget spent your ads sold X ROAS of products".
Conversions Metrics:
- Rate: this is the ratio of how many total conversions divided by clicks. If the number is over 100%, then that means some ad clicks produced multiple conversions in the same visit. Think of this as what percentage of ad clicks completed a conversion.
- Value: for non-ecommerce activities, we have assigned reasonable values for each conversion. For instance, watch a video might be $2.50 each, but time over 1 minute might be only valued at $0.50. (We can review these values with you and adjust reporting at any time).
- Cost Per: shows how much per that conversion grouping was paid. In the case of the Purchase Path Example, $5,150 spent divided by 1,862 conversions = $2.77
- ROI: this is the sum of the conversion value (both measured e-commerce and marketing value for each conversion) divided by amount spent. When the amount is over 100%, we use an X. So 325% is shown as 3.25X.
- ROAS: "return on ad spend" & calculated by dividing the Measured Purchase Value by Budget Spent [$39,164 / $5,150] = 7.60. Think of ROAS as a multiplier - in this case "for every $1 spent, the ads ads sold $7.60."
SECTION 7 Details
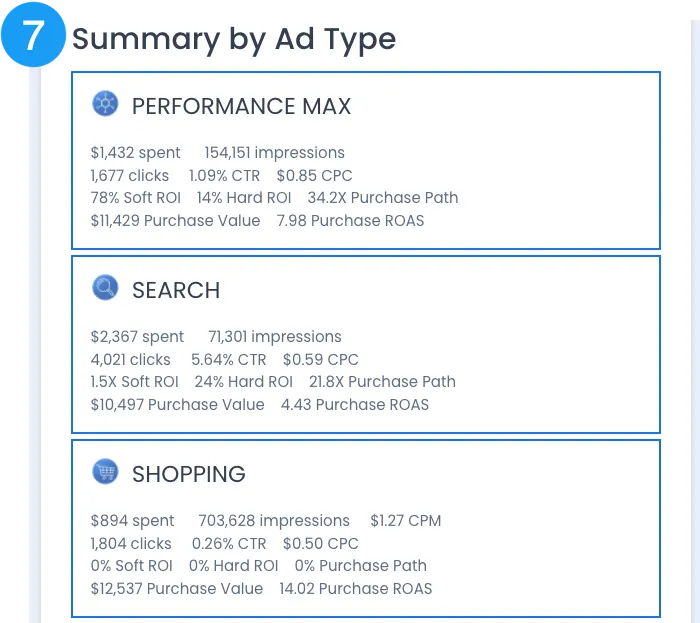
This section details the metrics reviewed above, but segmented by each type of online ad.
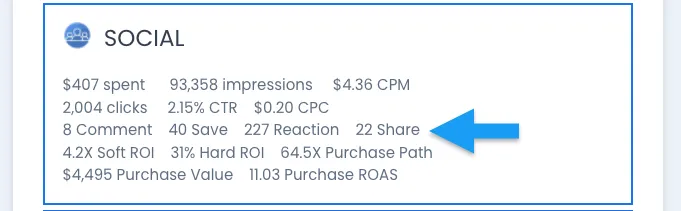
Social also details the different types of engagements
SECTION 8 Details
We repeat the contact information for your sales representative.
Regular Email Reporting
Conversion Dashboard Report
Please see the following tables to detail each section of your Conversion Dashboard report.
(1) Order Name
Select one or more of the main orders to filter by. We also call this the "Insertion Order Name"
(2) Order Number
Same as (1) but use the assigned Insertion Order number
(3) Ad Type
You can also select the type of platform(s) you want to filter this report by. You can select multiple choices.
(4) Line Item
Select one or more line items you want to filter by. We create line items to organize the ad targeting and platforms we're targeting for you.
(5) Line Number
Same as (4) but we assign a line number to the Line Item, much like a SKU
(6) Date Ranges
Use this filter to select the dates you would like to evaluate the data for. Most reports default to the previous 30 days, but your report may vary.
(a) Spend
Amount spent for the filters applied above and the time period selected.
(a1) is the graph of Spend for the time period you selected
(b) Impressions
The total number of times your ads were displayed.
(c) eCPM
This displays the average cost of every 1,000 impressions. It is calculated by dividing Spend by Impressions/1,000
(d) Link Clicks
The total number of direct links upon your ads
(d1) is the graph of the Link Clicks for the time period you selected
(e) New Visitors
Number of people that clicked upon your ads and had not previously been on your website in the past 90 days. (Note this metric starts reporting 90 days after your conversion code was installed on your website).
(e1) is the graph of the Link Clicks for the time period you selected
(f) New Ratio
Ratio of new visitors divided by the Link Clicks amount. Think of this as what percentage of the direct link clicks that are new prospects to your site
(g) Trend Graph (and color)
Each of the trends are compared to the previous period. For instance, if you filtered the report to 30 days in April, this graph is comparing to the previous 30 days in March. Percentages in green, that is an improvement or lover cost. Percentages in red are a decline or higher cost.
(1) Conversions
The total of all conversions: Soft, Hard and Purchase Path
(1.1) Conv %
Total Conversions divided by Impressions. This is a high-level "rough" metric as not every conversion has the same value to your company. However this metric is useful to watch over time.
(2) C T R
"Click Through Rate" measures the ratio of people that viewed your digital ad and clicked upon the ad for more information. It's calculated as Link Clicks divided by Impressions. This is the classic metric for direct response advertising. It is not a good measure of brand value because it focuses only on direct ad clicks.
(3) C P C
Cost Per Click - average cost for each link click to your website.
(4) Ret'n Visitors
Counts the number of Link Clicks performed by users who have been to your website in the last 7 days.
(4.1) Return Ratio
Divides the Ret'n Visitors amount (5) by the Link Clicks amount (d). In this example, 21% of the Link Clicks came from people that had been on your website in the last 7 days.
(i) Soft Conversions measure "Engagement" on your website for people clicking on your digital ads.. We count three actions and total those on the far left: (a) How many people scroll at least 50% down one of your webpages PLUS (b) how many people stayed on your site for more than 1 minute; PLUS (c) how many people visited 3 or more pages during their visit.
(j) For people clicking on your ads, Hard Conversions measure key actions on your site such as watching a video, downloading a catalog, signing up for a newsletter, or sending you an email. The number to the left is the count of those actions.
(j1) The Cost / Conversion is the Budget Spent value (item a) divided count of hard conversions (item j).
(k) Purchase Path conversions count any activity on your site indicating "purchase intent". Add to Cart & Initiate Checkout are two examples. So too is "Find a Dealer". The value to the left is the total count of those conversions.
(k1) The Cost / Conversion is the Budget Spent amount (item a) divided by the Purchase Path count (item k).
(l) We count the number of "Add to Cart" clicks. The number to the far left is the number of times the "Add to Cart" button was clicked. Our code captures the price displayed adjacent to the Add to Cart button.
(l1) The Checkout Value figure is the total of all those Add to Cart clicks' displayed prices.
(m) This counts the number of Initiate Checkouts. This is usually when the person is done adding items to the cart and starts the process of entering shipping address and payment information.
(m1) is the total amounts of items people initiated checkouts with.
(n) We capture actual website purchases attributed to your digital ads. "Orders" is the count of unique orders.
(n1) "Order Value" is the total value of the completed orders before shipping and sales tax.
(n2) "ROAS" is the order value amount divided by the Budget Spent (upper left corner). Think of ROAS as a multiplier - "for every $1 of budget spent your ads sold X ROAS of products".
(o) Line Name: We create line items and name appropriately to organize the ad targeting and platforms we're targeting for your goals.
(p) Line #: Same as (4) but we assign a line number to the Line Item, much like a SKU
(q) Ad Type : We list the type of ad this line was targeting.
(r) Spend: how much you spent for the time period for this line.
(s) Impressions: The total number of times your ads were displayed for this line.
(t) eCPM: This displays the average cost of every 1,000 impressions. It is calculated by dividing Spend by Impressions/1,000
(u) Link Clicks: The total number of direct links upon your ads.
(v) CTR: measures the ratio of people that viewed your digital ad and clicked upon the ad for more information. It's calculated as Link Clicks divided by Impressions. This is the classic metric for direct response advertising. It is not a good measure of brand value because it focuses only on direct ad clicks.
(w) CPC: Cost Per Click - average cost for each link click to your website.
(x) Engt YT V: If the line target is "Social" this number is the total of all ad engagements like "comment", "share", "save", etc. If this line is type "YouTube" then this counts the number of video views (past 15 seconds on average).
(y) Soft: Soft Conversion Marketing Return on Investment. For each Soft conversion we assign a reasonable conversion value for each conversion action. These values are meant to approximate the "marketing value" we feel the action provides your company. See HERE for more details.
(z) Hard: Hard Conversion Marketing Return on Investment. For each Soft conversion we assign a reasonable conversion value for each conversion action. These values are meant to approximate the "marketing value" we feel the action provides your company. See HERE for more details.
(aa) Cost / Path: We capture how many "purchase intent" actions were taken after clicking upon one of the ads. These intentions are "find dealer", "add to cart", "initiate checkout" and others. This metric is the Budget Spent divided by the count of these purchase path actions.
(ab) Order Value: When a user completes a final purchase, we capture the actual product value ordered.
(ac) ROAS: This is the Purchase Value divided by the Budget Spent. Each company involved in eCommerce has different ROAS benchmarks, but this will be a key metric for campaigns where final purchases are the primary objective.
Website Performance Dashboard


Sign me up
Receive our regular newsletter & invitations to our webinars.
Quick Links
Tailored Solutions


© Copyright 2026. Digital Throttle. All Rights Reserved.